Fall Report: Price Divergence..

By Dennis Rousseau, founder and president of AircraftPost.com. This article was originally published in the Aircraft Bluebook Marketline Fall 2015 edition.

In 2006, the average cost new for a Pro Line 4 equipped Lear 60 was ~$12.5M. In 2007 the Lear 60XR entered service with the Pro Line 21 avionics and an average cost new of ~$13M. The $500K delta basically gave the operator a Pro Line 21 cockpit and redesigned interior. The engines, fuselage, empennage, etc. were unchanged and both aircraft certified under the same type certificate (TC), A10CE. In the last few months a 2006 Lear 60 sold for $3.8M and a 2007 Lear 60XR sold for $3.8M.

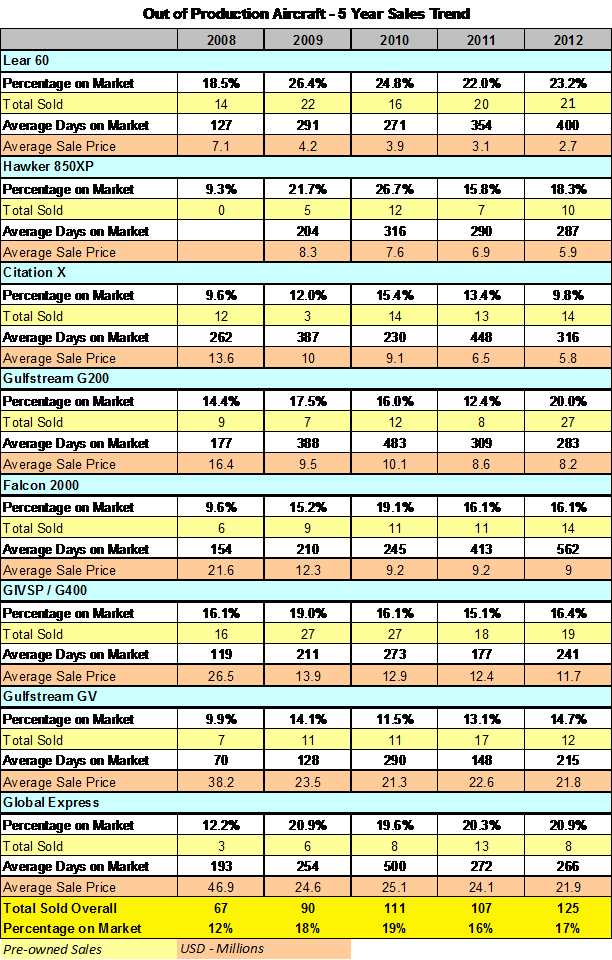
A 2007 Hawker 850 with 731-5BR engines had an average cost new of ~$13.5M and today has a resale value of $4.5M. A 2007 Hawker 900XP with 731-50R engines sold new for ~$14.5M and has a resale value of $5.4M. Other than engines, the aircraft are near identical (interior / exterior, Pro Line 21 cockpit…) and have the same TC (A3EU). All things considered, the above-mentioned facts represent quite an interesting scenario for value retention and age-based depreciation.

However, when the original cost new price point exceeds the $20M mark, the results portray a different picture, regardless of the manufacturer. In 2005 Dassault delivered the CFE738 powered Falcon 2000 with the Pro Line 4 cockpit (CRT displays) for ~$23M. The same vintage Falcon 2000 equipped with the EASy cockpit and P&W engines had an original price new of ~$25M. In the last few months a 2005 legacy 2000 sold for ~$10M whereas the same vintage 2000 EASy averaged ~$14M. Once again, the same type certificate (A50NM), fuselage, empennage and interior… a $2M delta when new, yet a $4M spread 10 years hence.

The Gulfstream GV and G550 are another example of this price divergence. A 2002 GV had an original price new of ~$42M. Its successor, the G550, had an average price new of $42.5M in 2003. The primary difference between the aircraft was the introduction of the Plane View cockpit, replacing the CRTs in the GV with 4 LCDs in the 550. Both aircraft shared the same TC (A12EA), fuselage, wing, empennage, etc. The average selling price today for the 2002 GV is $15M compared to the 2003 G550s $23M. The Challenger 604 (Pro Line 4) and 605 (Pro Line 21) follows a similar pattern. However, as large as the pre-owned price spread seems, with global economic conditions worsening and new aircraft deliveries slowing, it’s only a matter of time before the divergence becomes a convergence and aligns with the original price spread when new.

GV G550 Mark-to-Market Value

Summer Report: Market Roller Coaster or Stability…

By Dennis Rousseau, founder and president of AircraftPost.com. This article was originally published in the Aircraft Bluebook Marketline Summer 2015 edition.


During the last few years, AircraftPost has addressed many dynamics affecting the business jet market and specifically aircraft values. Our markets have changed dramatically since 2008. As we’re in our 7th year of ‘recovery’ the same recurring question is asked, “Is the business jet market improving?”

When we see a backlog in new aircraft deliveries with waiting times exceeding 2 years, pre-owned sales tend to increase as was the case in 2000 with the dot com hyperbole or the run-up to the financial debacle in 2008. However, we do not have these type events to stimulate new or used aircraft sales. On the global economic side, the same countries that were boosting sales of business jets (China, Russia, select countries in the EU and South America) are undergoing harsh austerity measures. This is returning North America to being the dominant player in new aircraft sales, which in and of itself is not a bad thing, it simply leaves the US market carrying the weight when our economic growth is batting ‘0’.

Good News

Our industry recently experienced an influx of good news and technological advancement with the announcement of the Falcon 5X, the Gulfstream G500/600, the Cessna Latitude, certification of the Embraer Legacy 450 and the Honda Jet, first flight of the Pilatus PC 24 business jet as well as the Falcon 8X.

Good News / Bad News

The backlog for new aircraft deliveries is declining. Bombardier is reducing production of the Global 5000 / 6000 and have ceased production of the Lear 60XR. Out of production aircraft inventories continue to rise, exceeding 10% of the available fleet. For most pre-owned aircraft the number of transactions year-over-year are down and prices across the board continue to deteriorate. The GV experienced a 22% drop in price from 2013 to 2014 and a further 16% in 2015, which in turn may have sparked an uptick in the number of transactions. A similar scenario played out with the Challenger 605 and Global Express XRS where year over year pricing declined and transactions increased. In all cases the price declines well exceed the effects of age-based depreciation.

Market Stability

Overall our markets are moving in pockets. What seems to be driving sales is value or better stated, “How much aircraft can I buy for the dollar?” The GV may be the dominant market player today but if history repeats itself, another aircraft will soon takes its place.

The following chart summarizes select business jet model sales from January through May for each reporting year.

Summer 2015-2


Spring Report: Market Temperature

By Dennis Rousseau, founder and president of AircraftPost.com. This article was originally published in the Aircraft Bluebook Marketline Spring 2015 edition.

At the end of each year we tally the number of aircraft delivered into service (EIS) by manufacturer and model. We then calculate the number of [pre-owned] aircraft, as a percentage of the fleet that came on the market during the course of the year as well as the percentage of the [pre-owned] fleet that sold. The number of aircraft entering or on the market fluctuates almost daily as aircraft are withdrawn or sold. In turn, this information provides quantifiable data from which we can extract market conditions and direction. By gathering actual selling prices and ask prices (vs. ‘Make Offer’) we can then dissect this further to reflect market depreciation.

Of concern today is the total in-service aircraft of a specific make/model, relative to the number of sales and their corresponding effect on residual values. A good casein-point is the price point of the Challenger 604 starting in 2009 when the average selling price went from $21M in 2008 to 12M and available inventory spiked to 95 aircraft (26% of the fleet) by 2012. It would be easy to surmise that the price decline was a direct result of the total number of in-service aircraft. The production run delivered 365 aircraft over a 10-year time frame, 1996 – 2006. Conversely, it’s nearest competitor, the Falcon 2000 delivered 230 aircraft from 1994 – 2006 and retained stronger residual values, as is reflected in todays selling price. Further consider when we add to these production numbers the various iterations offered in the ensuing years (i.e., the CL605, 2000 EX, EASy, LX, S), the EIS totals broach the 540+ aircraft for the 2000 series and 650+ for the CL604/605.

Challenger 604-2000

On the upper end of the spectrum the Gulfstream G550 ended 2014 with 475+ aircraft in-service since customer deliveries began in 2003. This in addition to the 192 GVs built from 1996 – 2002, brings the total to 665+ aircraft. The number of pre-owned 550s on the market has increased from 34 aircraft in 2013 to 55 in 2014, with the total [pre-owned] sales increasing from only 19 in 2013 to 22 in 2014, as the total in-service aircraft fleet continues to grow.

G550-spring

Over the last 5 years (2010-2014), an average of 35% of the aircraft that come on the market, sell to end-users. This has remained fairly consistent year over year, fluctuating at most +/- 2%. However as the number of aircraft on the market [as a percentage of the fleet] increases, the sheer volume has the propensity to drive selling prices downward. As has been the case in the business jet industry for many years, near term selling prices are typically tied to the most recent [low-ball] sale which further exacerbates any hope of price stabilization.

Spring-market summary

We are at a pivotal point in our industry from the perspective that we’ve not seen such high production in the super mid-size to long-range business jets. In the small jet category, the Lear 35 and Citation II, which produced 676 and 734 aircraft respectively, are good indicators of the effects of high production and lower residuals. Over the next couple years I believe we can approach the market with an element of certainty in that [new] aircraft production will inevitably continue and pre-owned market pricing will try to find its way among an over crowded market.


WINTER REPORT: Market Depreciation vs. Declining Residual Values

By Dennis Rousseau, founder and president of AircraftPost.com. This article was originally published in the Aircraft Bluebook Marketline Winter 2014 edition.

In 1999, a new Gulfstream GV sold for ~$39.5M. Considering a ‘useful life’ of 30 years and an average utility of 500 hours per year, a 1999 year model in 2014 (midlife/15 years) would be considered ‘average’ with ~7,500 hours total time. When we consider a ‘normal’ value retention of 20 percent of the original cost new, at the end of 30 years we would expect a market value of ~$7.4M and a midlife value of $22.1M. In fact, the midlife value today is closer to $15.2M. Will the market continue to hasten depreciation beyond what should reasonably be expected for a 30-year old aircraft? Are longer-range aircraft affected more than those in the small and medium-jet categories? Do aircraft with higher production runs (350+) depreciate quicker?

Let’s look at a random selection of aircraft in the small and medium-jet categories and examine value retention over six years. When we apply a 30-year age-based depreciation schedule to aircraft, the aircraft (over six years) should yield a market value of ~80 percent of its original cost new. As depicted in the chart, the values retained after six years are well below what a ‘normal’ market would deliver, in some cases dropping more than 60 percent.

2008 Model Yr Values

Could this be indicative of the lower end of the business jet market depreciating quicker than those aircraft with greater capability (i.e., longer range, larger cabin)? Further consider that the price points of these aircraft are coming so close that decision making leans in favor of an aircraft with a stand-up cabin and greater range (aka ‘getting the most value for the dollar’). By way of example, YTD 2014 the average selling price for a 2008 Lear 45XR is $4.9M and a 2008 Lear 60XR $5.2M. Perhaps the dynamic in passenger requirements is trending to greater range and capability for near the same dollar. At the end of the day, OEMs are building next generation aircraft that go further, fly faster and higher, have lower cabin pressure altitudes, extended design life and reasonable price points relative to the technology and capabilities, which will certainly change the market dynamics in the near term.

1999 GV

Spring Report: Price Perspectives

By Dennis Rousseau, founder and president of AircraftPost.com. This article was originally published in the Aircraft Bluebook Marketline Spring 2014 edition.

On average, five – seven percent of the available fleet on the resale market is considered ‘normal.’ Should the percentile lean more in the 10 – 20 percent range, we then tend to see some severe price cutting as was the case with the Challenger 604 in 2013, where we saw 47 transactions and average selling prices drop from 9.5M in 2012 to an average of 7.2M in 2013. We should also expect seven percent of the available fleet to trade hands during the course of a ‘normal’ year.

When we consider year-over-year pre-owned business jet sales, total annual transactions are up each year since 2008, and more than 50 percent
when comparing the 2008 results with those of 2013! In some circles that could be construed as a successful rebound; however, whether we review current production aircraft or out-of-production, selling prices are down more than 50 percent when comparing the results of 2008 with year-end 2013 and continue a downward trend with the start of 2014.

If you consider an aircraft has a useful life of 30 years and apply the effects of major maintenance events and age-based depreciation through the end of life (aka salvage value), we then have a fairly predictable course for
determining value at any given point (minus inflationary effects). However, when we incorporate the instabilities and uncertainties of the overall aircraft market and global economic factors, our once predictable course
becomes uncharted. When taking these latter points into account, it becomes apparent that our once stable markets are now reflecting selling prices 30 percent under what could be deemed a normal course of events.
From another perspective, perhaps this present course is our ‘new normal’.

Reflecting on the results of 2013, the average days on the market are hovering around the 300 mark and/ or 10 months. As well, on average there’s a 9 percent
difference between the ask price (at time of sale) and sell price. If the aircraft is priced commensurate with the market, buyer/seller expectations stay in check and the number of aircraft on the market continues below 10 percent of the available fleet, perhaps we can better define the ‘new normal’ in 2014.

Summer Report: YTD PRE-OWNED TRANSACTIONS & PRICES CONTINUE DOWN

By Dennis Rousseau, founder and president of AircraftPost.com.  This article was originally published in the Aircraft Bluebook Marketline Summer 2013 edition.

When viewing a random selection of pre-owned transactions for the first 5-months of 2013, the number of sales are trending down 15 percent when compared to the same period in 2012. Actual selling prices also are down on average 15 percent, while inventory levels for the same group of business jets has increased 20 percent.

As you consider these facts we must also take into account other mitigating factors, such as the year of manufacture of the aircraft sold, cost of the aircraft when it was new, the cost new today, as well as nominal depreciation, et al. By way of example, an aircraft that sold new in 2005 for $44 million and today sells for $32 million is not too far off of a 4 percent per year depreciation schedule. From another perspective, it has retained 73 percent of its original cost , which falls in line with a 30-year useful life.

A number of factors continue to affect growth and stability in our industry – some are geopolitical, others are related to the global financial debacle that started in 2008.

Within our industry, where 250 aircraft were once considered a standard production run, we now have 400+ that will eventually compete in the pre-owned market. Therein in the case of ‘over-production’, we face dynamics that were once not a factor, such as eroding residual values. As the business jet fleet ages and pre-owned inventory increases, will pricing continue to erode? What effect will new aircraft pricing and shorter delivery times have on the pre-owned market?

Jan-May_2012-2013_comparison_1

Jan-May_2012-2013_comparison_2

Spring Report: PRE-OWNED TRANSACTIONS ON THE RISE

By Dennis Rousseau, founder and president of AircraftPost.com. This article was originally published on the AircraftPost blog and in the Aircraft Bluebook Marketline Spring 2013 edition.

For the fifth consecutive year, pre-owned transactions for current generation business jets have shown a year over year increase. However, market inventories, expressed as a percentage of the fleet, are on the rise, while the average selling price continues a downward trend.

When we factor age-based depreciation over a 30-year lifecycle, we can garner some semblance of normalized value at any given point. However, when we consider economic events such as those over the last four years, values and selling prices can take a drastic downward turn. At the end of 2012, the average selling price for pre-owned, current production aircraft was reflecting a 17% decline in market value. Out of production aircraft slipped further to 33% under normalized values.

There are a number of factors contributing to the state of our market(s). The increase in transactions and current pricing suggests buyers are realizing substantial value in select aircraft. For example the G200, with its stand-up cabin, 3000 nm range and Pro Line 4 cockpit, had a record 27 transactions in 2012, an increase of over 300% from 2011. A 2008 year model, with a list price new of $22M, sold for $10M in the 4th Quarter 2012, with under 800 hours total time. The same $10M could buy a 2001 Challenger 604 or Falcon 2000 with 3500 hours, or a 2004 Challenger 300 with 7500 hours. Buyers seem to be looking more laterally with the perception of ‘how much value can I buy for the same dollar.’ Obviously, the newer aircraft open up greater financing opportunities as well.

Compared to 2008, when pre-owned aircraft were selling for more than they cost new, 2012 continued to adjust prices to a level commensurate with the global economic climate. On average, pre-owned business jets are selling 25% under normalized markets, which seems to be one of the driving factors for the increased transactions. Further, according to GAMA new business jet deliveries for the first nine months of 2011 and 2012 were 427 and 428 respectively. When current production pre-owned aircraft are selling for 40% less than they cost new, this can also stimulate the number of pre-owned transactions.

For the start of 2013, pre-owned inventories are on the rise; however activity levels (pre-purchase inspections, LOIs, Offers to Purchase, et al) are showing formidable signs for consistent activity.

Current Production Aircraft 5 Year Sales Trend

Current Production Aircraft 5 Year Sales Trend

OutofProd_5yr_Spring2013

Pre-owned Business Jet Transactions on the Rise

For the fifth consecutive year, pre-owned transactions for current generation business jets have shown a year over year increase. However, market inventories, expressed as a percentage of the fleet, are on the rise, while the average selling price continues a downward trend.

When we factor age-based depreciation over a 30-year lifecycle, we can garner some semblance of normalized value at any given point. However, when we consider economic events such as those over the last 4 years, values and selling prices can take a drastic downward turn. As of the end of 2012, the average selling price for pre-owned, current production aircraft was reflecting a 17% decline in market value. Out of production aircraft slipped further to 33% under normalized values.

Current Production Aircraft 5 Year Sales Trend

Current Production Aircraft 5 Year Sales Trend

Out of Production Aircraft 5 Year Sales Trend

Out of Production Aircraft 5 Year Sales Trend

There are a number of factors contributing to the state of our market(s). The increase in transactions and current pricing suggests buyers are realizing substantial value in select aircraft. For example the G200, with its stand-up cabin, 3000 nm range, and Pro Line 4 cockpit, had a record 27 transactions in 2012, an increase of over 300% from 2011. A 2008 year model, with a list price new of $22M, sold for 10M in the 4th Quarter 2012, with under 800 hours total time. The same $10M could buy a 2001 Challenger 604 or Falcon 2000 with 3500 hours or a 2004 Challenger 300 with 7500 hours. Buyers seem to be looking more laterally with the perception of ‘how much value can I buy for the same dollar’. Obviously, the newer aircraft open up greater financing opportunities as well.

Compared to 2008, when pre-owned aircraft were selling for more than they cost new, 2012 continued to adjust prices to a level commensurate with the global economic climate. On average, pre-owned business jets are selling 25% under normalized markets, which seems to be one of the driving factors for the increased transactions. Further, according to GAMA new business jet deliveries for the first 9 months of 2011 and 2012 were 427 and 428 respectively. When current production pre-owned aircraft are selling for 40% less than the cost new, this can also stimulate the number of pre-owned transactions.

For the start of 2013, pre-owned inventories are on the rise; however activity levels (pre-purchase inspections, LOIs, Offers to Purchase, et al) are showing formidable signs for consistent activity.

This analysis was created and published by AircraftPost.com

Question: I am thinking of selling my Gulfstream IV. How can I determine its true resale value?

As seen in Fly Corporate:

I am thinking of selling my Gulfstream IV. How can I determine its true resale value?
George Dubroux, Entrepreneur

As soon as an aircraft enters service, the asset begins to depreciate. Traditionally a safe guideline for market depreciation has been 3 to 4% per year. However, the current market for used aircraft can hardly be considered traditional. In addition to economic considerations, major maintenance, avionics upgrades, modernisation, engine programmes, total flying time and the number of cycles will all impact the baseline value of your asset. With proper planning and the right intelligence, resale value can be calculated in fairly short order.

A new Gulfstream IV (GIV) cost $21 M (€14.4 M) in 1990. Standard features include 13 passenger capacity, aft galley, forward and aft lavatories and an SPZ 8000 Flight Control System with dual FMS and Laseref. The standard engine warranty was five years or 2,500 hours, completion warranty one year, non-structural components (including avionics) five years. At some point, after the basic warranties have expired, assuming an annual usage of 500 hours, the aircraft will incur major capital expenditures for engine inspections (at 4,000 hours or 10 years), airframe check (72 month intervals), gear overhaul (5,000 cycles), avionics upgrades due to regulation and modernisation requirements, and interior refurbishment among other items.

Fleet Comparison Vital
As an aircraft ages you must compare it to the rest of the fleet. How many hours has it flown relative to the fleet, is it enrolled in an engine programme, what is the interior configuration, and have the avionics been updated recently? As of September 2009 the average total time of the GIV fleet was 8,600 hours, 20% were enrolled in an engine programme, 73% were configured with an aft galley, 71% were equipped with Satcom, while 8% had a Head Up Display. Drawing the fleet comparison model gives you a fairly good idea of how your aircraft compares. Excessively high time, a lack of major optional avionics, or an upcoming major maintenance event can all impact baseline value and ultimately resale pricing.

Armed with fleet intelligence you can then compare your aircraft to those currently available on the market. Don’t just compare it with other GIVs, but include competing makes and models. If you can purchase a Challenger 604 or Gulfstream IV SP for $12 M (€8.2 M), why would you pay near that for an older GIV?

The percentage of the fleet that is for sale will also affect value. As a rule of thumb, the baseline value assumes that around 10% of the available fleet is for sale. If it is less than this, the baseline value can be adjusted up – if its higher it needs to be adjusted down. There were 36 GIV aircraft, 16.8% of the fleet, on the market as of 10 September. Therefore the baseline value should be adjusted down around 7% to compensate.

Long-Term Planning
Any prospective seller should ask themselves why their aircraft would sell before the 36 currently available. Current average time on the market for the GIV is 214 days, although 16 have been available for over a year. Recent major maintenance or refurbishment may give you an edge, but your pricing must be attractive, especially when compared to recent sales of GIV and competing models. In the case of the GIV, asking prices range from $7.9 to 12.9 M (€5.4 to 8.9 M) but twenty-one are listed without a firm price (Make Offer). There have been two sales in the past six months, both in the $9 M (€6.2 M) range (+/- 2%).
There are many factors that need to be considered before you price your aircraft. If possible, put a long-term strategic plan in place to track and monitor present value, fleet statistics and market activity on an on-going basis. Before you make major capital investments in your aircraft, first establish what impact it will have on the value of the asset, not only today but also longer term.
Never place an aircraft on the market at Make Offer and never price it near or above the cost of a new model. Doing either of these two things will cost you more in the long run.
Dennis Rousseau, Founder and President of AircraftPost Inc.

BCA Quotes Dennis Rousseau on the Used Aircraft Outlook for 2012

AircraftPost president, Dennis Rousseau, was recently asked by Business & Commercial Aviation to give his outlook on the used aircraft market in 2012. In an article entitled Used Aircraft 2012 which was published in the magazine’s May edition, Dennis shares his thoughts on the market:

Dennis Rousseau of Aircraftpost.com pointed out that the number of aircraft for sale is actually rising for many types, while transaction prices are still dropping. Plus, the macro economic picture is not rosy. “By 2012, the economic recovery was supposed to be here.  I don’t see it. Plus, fuel prices are going through the ceiling.”

However, Rousseau does see plenty of opportunities for would-be buyers. “What we are seeing is value. Pricing is more in line with the reality of the markets. We are running at about 30% under a normalized market,” which offers buyers “historic bargains.”

For the price operators paid for a small jet in 2008 they can buy a medium jet today, added Rousseau, and some operators are trading up. “People are buying not necessarily for their travel needs today, but for the foreseeable future.”